

This is more of an update to pt. 1. I decided to improve my Python code. I discovered that yes, you can iterate through the alphabet using “import ascii_uppercase,” thanks to this StackOverflow article. It took me 28 minutes to improve the code and 9 minutes to edit another newspaper, but this time the newspaper’s OCR was much more crisp and I took a few more shortcuts with the editing without sacrificing characters.
#Evening star. (Washington, D.C.), April 05, 1934,
import re
from string import ascii_uppercase
f = open("EveningStar040534-OCR.txt", "r")
teststring=(f.read())
caps = teststring.upper()
regex = re.findall("[A-Z]",caps)
newspaperCharLst = []
for letter in regex:
    newspaperCharLst.append(letter)
for letter in ascii_uppercase:
    print(letter,": ",newspaperCharLst.count(letter))
# 28 minutes
# 9 minutes to edit OCR

I was pleased to find that my code worked about the same either way, and I only had one major discrepancy between the two newspapers at the letter K, which was pretty significant, but a quick scan of the Evening Star didn’t reveal any glaring mistakes, so I’m going to let it go:

The new data from the Evening Star didn’t substantially change the chart relative to points and distribution:
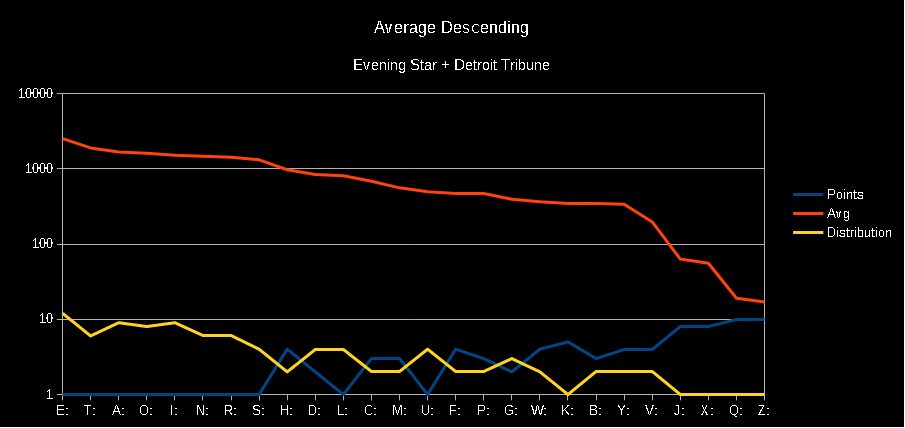
That jagged line in the middle of our letters still bothers me. I tried out using standard deviation to see if a Bell curve helped me discover why the points and distribution creates invert one another, but that math did not work out… or, I just don’t know when or how to apply standard deviation. Very possible. I never took a stats class. It was fun to learn how to do it, though.
https://chroniclingamerica.loc.gov/lccn/sn83045462/1934-04-05/ed-1/seq-1/
